
My Dashboard provides a visual overview of your key performance indicators (KPI's)
Select the Charts from the charts library that you want to display on your My My Dashboard
TABLE OF CONTENTS
- Charts
- Dashboard Date range
- Listings Dashboard tab
- New Rentals
- Appraisals tab
- People tab
- Websites tab
- Promotions tab
- Sales tab
- Staff tab
- Multi Offices companies
- Agents
- Agent Teams
Charts
Go to the charts page and select the Charts that you want to display on your Dashboard
Select the Star to add to your Dashboard
When you have selected a chart to display on your dashboard you will see a short cut link on your desk top
to your Dashboard called My Dashboard.
Dashboard Date range
Use the Date range drop down to change your chart date range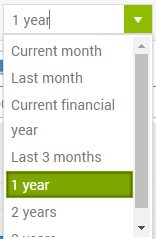
Listings Dashboard tab
- New Listings - New listings added to your office. The date used is the listing Listed in Office Date and listing status; Available, Conditional, Unconditional or Withdrawn within the selected date range.
- Available Listings - Listings that either have the status Available or Conditional within the date range. e.g. If a listing was made Available two months ago ( but has since been sold) it will appear as Available in that month.
New Rentals
Displays the number of new rental properties made available each month.
New Rentals are counted using the date the property is made available for rent.
The Rentals tab is only displayed if Rentals are enabled for your Office.
Appraisals tab
Number of Appraisals created and if they eventuated to a potential listing or nothing came of them.
People tab
- New Contacts that have been added,
- Activities - out bound activities
- eNews sent - the number of emails sent
Websites tab
Activity for websites where you are importing email enquires
Promotions tab
The number of Promotions created each month
Sales tab
The number of Sales, Sale price and Commission into office
Agent Sales charts:
Sale volume; Every Agent attached to a Sale is given credit for their share of 1.
Sale Commission and Sale Price charts use a proportion of the sale to calculate the value for each agent.
e.g. A Sale at $960,000 with 3 Agents. Each agent will be attributed 1/3 i.e. $320,000 each of the sale price.
Staff tab
Current Staff - includes all Staff in the Office
- Staff Start date is used for when they started and their Finish date when they have left.
- Inactive Staff are include but not Deleted Staff
Selling Agents - include Staff marked as Selling agents, Auctioneers or Property managers
New Staff - added to the office
Finished Staff - where the Staff member has a Finish date
Staff Type - As at Now the number of Selling Agents Pm and Admin staff
Staff Gender -As at Now the number of Male, Female & Unassigned
Staff created as Pending and then changed directly to Inactive are treated as Deleted
Multi Offices companies

Use the Office.. box to select an Office in your company by default all Offices in your company will be displayed.
Agents
OSL agent users can view their own Charts
Agent Teams
Team Dashboards allow agents to view the combined activity and performance of all agents within their team.
A Team is a group of agents who work together. When an agent belongs to a Team, their dashboard automatically includes information for all members of that Team, rather than displaying only their own records.
For example, if a Team has two agents, the dashboard will combine the records from both agents to provide an overall view of the Team's performance.
What information is included?
Team Dashboards display combined information for all Team members, including listings, sales and other dashboard statistics.
This allows agents to monitor their Team's overall activity, track performance and see how the Team is progressing.
Note: Team Dashboard information is based on the agents assigned to the Team. Changes to Team membership will be reflected in the dashboard data.